 |
 |
 |
 |
CHAPTER 12 OVERVIEW OF SEPARATE INVESTIGATIONS |
||||||||||||||||||||||||||||||||||||||||||||||||||||||||||||||||||||||||||||||||||||||||||||
12.3 Estimate of maximum wave loads on the visor for the conditions at the accident |
||||||||||||||||||||||||||||||||||||||||||||||||||||||||||||||||||||||||||||||||||||||||||||
|
After the ESTONIA had changed course at the waypoint she sailed for about half an hour at about 14 knots in bow seas before the failure of the visor attachments. The significant wave height has been estimated by different meteorological institutes to 4.0 - 4.1 m at 0100 hrs at the accident site. Based on the results from model tests and numerical simulations, the Commission has evaluated a probable range of maximum wave loads on the visor during this last period.
Table 12.4 Summary of wave load probability distributions for the model test: Hs = 4.5 m, 150° bow sea, 14.5 knots speed.
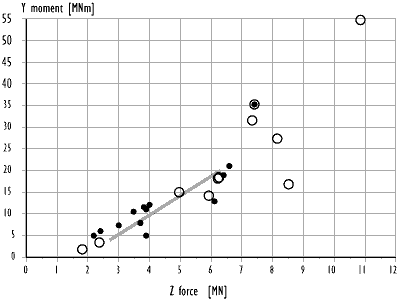
Finally, the loads for the accident condition were roughly estimated by reducing the model test loads with respect to the differences in significant wave height, 4.5 m and 4.0 - 4.1 m respectively. The forces were reduced by 30 % and the moments by 50 %. The level of reduction in forces is taken from the numerical simulations, see Table 12.3 and Figure 12.9, while the reduction in moments is based on an analysis of the correlation between forces and moments, Figure 12.10.
Figure 12.10 Correlation between vertical forces and opening moments from model tests. Rings show the single highest measured value in the different series, black dots show the 13 highest values in the test with bow sea and Hs=4.5 m. The line shows the estimated range of maximum loads for the accident condition.
The Commission's estimate of maximum wave loads on the bow visor for the accident conditions is summarised in Table 12.5. Since the waves in the model tests had rather high crests compared to their troughs, this estimate may be on the high side. On the other hand, the uncertainty in sea state is, according to the meteorological institutes, about 0.5 m in significant wave height. Were this uncertainty also accounted for, the maximum values in the given range would increase significantly. Table 12.5 Summary of estimated maximum wave loads for the accident conditions. Oblique bow sea, Hs 4.0–4.1 m.
|
||||||||||||||||||||||||||||||||||||||||||||||||||||||||||||||||||||||||||||||||||||||||||||
12.4 Predictions of wave-induced motion |
||||||||||||||||||||||||||||||||||||||||||||||||||||||||||||||||||||||||||||||||||||||||||||
12.4.1 Computation methodTo analyse the general situation on board the ESTONIA with regard to wave-induced motions, numerical predictions have been made by applying the linear strip theory and the linear superposition principle. The strip theory underlies a very well known numerical method which has been validated in many comparisons with model and full-scale experimental results. In the present case also the theoretical results show good correlation with experiments.
The numerical results show in general that modal wave period and heading to waves have a greater effect on wave-induced motions than does forward speed within the wave periods and headings considered here. Significant motion amplitudes increase with increasing wave period and when the heading to waves changes from direct head seas towards beam seas. The motions were larger in short-crested seas than in long-crested with the exception of the heading 120°. The results indicate that the waves during the accident night were relatively short compared to the length of the ship and she was more or less running through the waves, in particular before midnight.
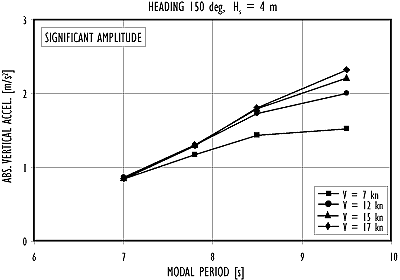
Figure 12.11 Vertical acceleration at the station of the bridge in bow sea with Hs=4 m.
The water level at the bow rose above the level of the car deck at nearly every wave encounter due to the combined vertical motion of bow and wave surface. On average, one wave in a hundred, i.e. one every five minutes, reached the level of the upper edge of the ramp opening. From here, there was still 2.5 m freeboard to the stemhead. On these occasions, spray and water reached the foredeck. Survivors have stated generally that there was quite a lot of spray and water flying in the air with occasional submergence of the bow. However, serious amounts of green water on the foredeck were rare as were real bottom slams. Flare impacts probably occurred much more frequently than bottom slams. |
||||||||||||||||||||||||||||||||||||||||||||||||||||||||||||||||||||||||||||||||||||||||||||
12.5 Determination of hydro-dynamic characteristics in heeled condition using model tests |
||||||||||||||||||||||||||||||||||||||||||||||||||||||||||||||||||||||||||||||||||||||||||||
|
It has been discovered both from the sonar investigations of fragments on the seabed and from manoeuvring simulations that the ESTONIA made a port turn at an early stage of the accident. To determine whether the port turn could possibly have been initiated spontaneously by the ship's changed hydrodynamic characteristics when she started to heel in forward speed, a series of model tests was carried out at SSPA Maritime Dynamics Laboratory in conjunction with the wave load tests. A full report of the test results is given in the Supplement.
|
||||||||||||||||||||||||||||||||||||||||||||||||||||||||||||||||||||||||||||||||||||||||||||
12.6 Simulation of flooding and sinking of the vessel |
||||||||||||||||||||||||||||||||||||||||||||||||||||||||||||||||||||||||||||||||||||||||||||
|
Theoretical studies were ordered by the Commission to clarify and simulate the rapid flooding, capsize and sinking of the ESTONIA. These studies include analysis of hydrostatic floating conditions and stability, wave-induced motions in heeled condition and water inflow rate on the car deck in the initial phase of the capsize. The full reports are included in the Supplement. Below is given only a brief summary of the major results.
New stability calculations were carried out for the Commission, based on the latest valid inclination test. The calculations confirm that for the loading condition of the accident voyage the ESTONIA satisfied the two-compartment damage stability requirements specified in the SOLAS 1974 Convention. The damage stability requirements concern only the watertight part of the vessel below the bulkhead deck, i.e. below the car deck in this case.
Figure 12.12 ESTONIA’s static stability curves for different amounts of water on the car deck, ship side assumed intact.
Figure 12.13 ESTONIA’s list against the amount of water on the car deck.
Even though the list developed rapidly, the water on the car deck would not alone be sufficient to make the ship capsize and lose its survivability. As long as the hull was intact and watertight below and above the car deck, the residual stability with water on the car deck would not have been significantly changed at large heel angles (Figure 12.12). The capsize could only have been completed through water entering other areas of the vessel.
Figure 12.14 Freeboard to first possible flooding points plotted against amount of water on car deck. The openings are aft side windows on decks 4 and 5 at frame #6, bow ramp starboard corner, aft door on deck 5 and fore door on deck 5.
As soon as water was free to enter the accommodation decks all residual stability would be impaired and the ship in practice lost. Without an intact superstructure above deck 4, the largest possible equilibrium heel angle before a complete capsize would be 40°. This condition would be exceeded with about 2,000 t of water on the car deck.
The water inflow through the ramp opening after the visor had failed and was lost was simulated with two different numerical methods. One is similar to the numerical wave impact load simulation, i.e. an approach where the relative motions between bow and waves are described in the time domain. The other approach uses the frequency distribution of relative motions.
Results obtained from the simulations are very sensitive to small changes in the initial parameters, and the inherent uncertainty in the random nature of waves and ship motions during short periods of time is very large. Therefore, the results cannot be used to independently prove a certain time sequence of water inflow. The value of the simulations is primarily to verify whether the assumed capsizing scenario is possible with regard to the water inflow rate.
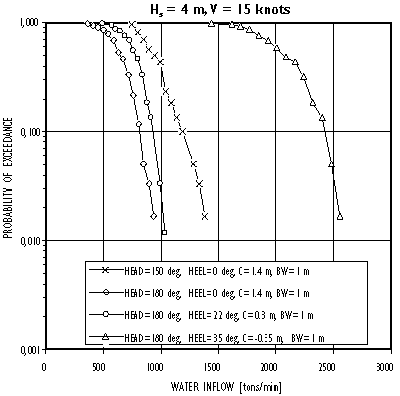
Figure 12.15 Probability of exceedance for different amounts of water inflow to car deck through bow ramp opening in bow and head seas at 15 knots speed with list angle as a parameter. C = Freeboard to the starboard corner of ramp, BW = bow wave height.
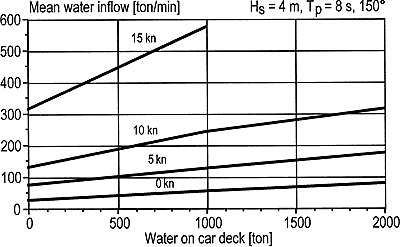
Figure 12.16 Mean water inflow as function of ship speed and amount of water on car deck in bow sea.
The successive phases of the capsize are dealt with in more detail further on in this report, where the time sequence and the full capsize scenario are analysed based on witnesses' statements and an interpretation of the results obtained from these simulations. Here the general influence of changing conditions is briefly summarised.
Continues... |
||||||||||||||||||||||||||||||||||||||||||||||||||||||||||||||||||||||||||||||||||||||||||||
 |
 |
 |
 |
