Previous Home Summary Contents

CHAPTER 12 OVERVIEW OF SEPARATE INVESTIGATIONS

12.1 Determination of sea loads on the visor by model tests

12.1.1 Test program

Extensive model tests ordered by the Commission have been performed at the maritime research centre, SSPA laboratories. The main purpose of the test programme was to determine the wave impact loads on the visor at the speed, on the heading and under the wave conditions in which the ESTONIA was likely to have been operating at the time of the visor failure. In addition, the influence of variations in some of these parameters was tested. The model test results have further been compared to computer simulations of wave loads as summarised in 12.2. SSPA's complete test report is appended in the Supplement.
A 1:35 scale model of the ESTONIA was built and equipped with propulsion units and controllable rudders. The bow visor was made separate from the hull and attached with a six-component balance to measure integrated forces and moments on the visor in all six degrees of freedom. The static weight of the visor was excluded from the measurements and the moments were transferred to the centre position of the visor hinge axis.
Sea load tests were carried out both in the towing tank (TT), for head sea conditions, and in the Maritime Dynamics Laboratory (MDL) for oblique sea conditions. The model was in both cases self-propelled. Long-crested irregular waves were generated according to the JONSWAP wave spectrum.
The model tests emphasised the determination of extreme values and the statistical distribution of loads. Two of the conditions were therefore tested in a large number of repeated runs with slightly modified wave amplitudes and phase lags.
The test programme in irregular seas consisted of the conditions given in Table 12.1.

Table 12.1 Test programme at the SSPA laboratories.
 HeadingSpeed, VSignificant Wave Height, HsMeasured time
NominalMeasured at bow
Towing Tank:
Head sea:180°10 knots4.0 m3.9 m30 min
180°15 knots4.0 m3.9 m320 min
180°19 knots4.0 m3.9 m20 min
180°10 knots5.5 m5.1 m60 min
180°15 knots5.5 m5.2 m40 min
180°19 knots5.5 m5.2 m30 min
MDL:
Head sea:180°15 knots4.0 m4.1 m30 min
Bow sea:150°10 knots4.0 m4.2 m30 min
150°10 knots5.5 m5.3 m30 min
150°15 knots5.5 m5.3 m30 min
150°14.5 knots4.3 m4.5 m180 min

A peak period of 8.0 s for the wave spectrum was used for all conditions except for the last one which used a period of 8.3 s. This last condition was at the time assumed to be the most probable condition in which the bow visor of the ESTONIA failed.

12.1.2 Summary of results

Due to the non-linear and random nature of the bow impact loads, the absolute quantitative measured loads must be judged with care. Small changes in the relative motion between the ship bow and the waves, as well as in the wave profile, resulted in large differences in load values. The maximum loads were not generally measured in the highest individual waves but rather in the worst combinations of waves and ship motions.
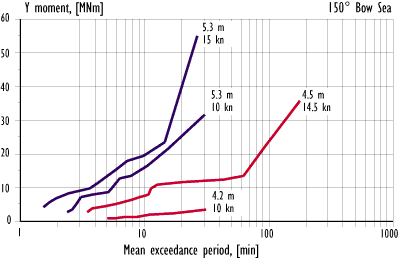
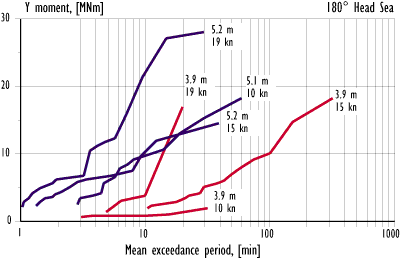
The most critical wave-induced load component, the opening moment around the deck hinges, the Y moment, measured in the different tests is plotted in Figures 12.1 - 12.2 on the basis of mean exceedance period. The vertical force, the Z force, is shown in a similar way in Figures 12.7 - 12.8. Mean exceedance period means here the average time between individual load peaks equal to or higher than the corresponding value. The graphs were produced by taking the total full-scale time of each test series and dividing it by the number of load peaks exceeding a certain level as given by the Weibull plot in SSPA Report 7524.

Figure 12.1 Measured wave-induced vertical opening moment on the visor in bow sea.

Figure 12.2 Measured wave-induced vertical opening moment on the visor in head sea.

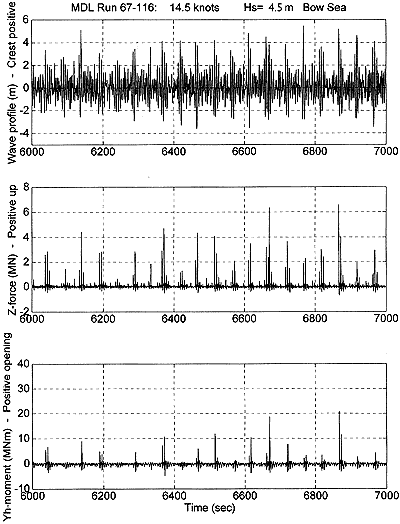
Figure 12.3 Example of time series from model tests.

The wave-induced forces and moments shown do not include the static weight of the visor itself. This will decrease the vertical force by about 0.6 MN and the opening moment by about 2.9 MNm. (1 MN equals the force of 102 metric tons).

12.1.3 Long test series in oblique bow seas

The long series of tests at MDL in port bow sea with a nominal significant wave height, Hs, of 4.3 m and a ship speed of 14.5 knots were, at the time the tests were performed, believed to represent the prevailing condition when the attachments of the visor of the Estonia failed. In this series, during three full-scale hours of measurements, the individual maximum components of wave loads on the bow visor were recorded as given in Table 12.2.

Table 12.2 Maximum wave load components in bow sea with Hs = 4.5 m.
Forces:
Longitudinal forceX force7.7 MN(directed aft)
Side forceY force2.7 MN(directed to starboard)
Vertical forceZ force7.4 MN (directed upwards)
Moments at the visor deck hinge position:
Moment about longitudinal axis,X moment10.2 MNm(upward on port side)
Moment about transverse axis,Y moment35.4 MNm(upward opening)
Moment about vertical axis,Z moment4.1 MNm(forward on port side)

All the maximum values except for Y force and Z moment were measured at the same incident (Y force was measured to 2.2 MN and Z moment to 3.8 MNm simultaneously). When these highest loads were measured, wave crest amplitude was 3.7 m, relative motion between bow and wave was 6.3 m and relative velocity 6.2 m/s.
The longitudinal and vertical force peaks always appeared in phase and with approximately the same magnitude. Only a few of these load peaks, however, resulted in a positive opening moment about the hinge axis that would have been large enough to exceed the closing moment from the static weight of the visor, and only two opening moments were above 20 MNm. Most of the load cycles caused closing moments with peak levels up to about 5 MNm.
Figure 12.3 shows an example of a time series of measured wave profile, vertical force on the visor and opening moment about the hinge axis. The figure covers about 17 minutes of full-scale time.

12.1.4 Wave load components - influence of wave height, heading and speed

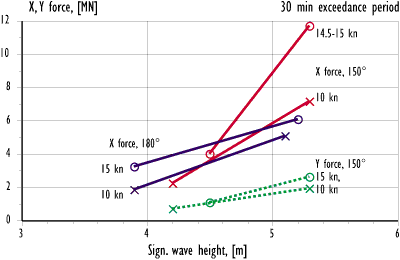
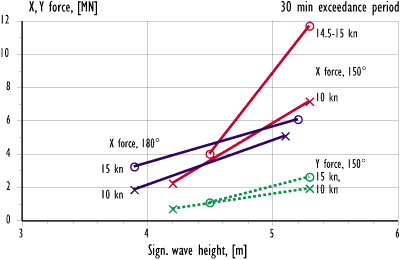
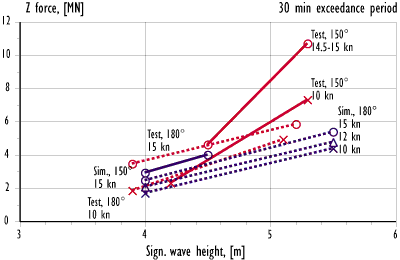
The influence of significant wave height, heading and speed on the wave-induced loads on the visor is summarised in Figures 12.4-12.6 and 12.9. In the comparison, the most probable maximum values over 30 min. of exposure are used. For most of the test series this means that the given value corresponds to the single highest measured, and hence the uncertainty in these levels is large. In the figures, the test results are connected with straight lines to show the same condition. However, the sea loads are a function of Hs raised to a higher power, and the straight lines should not be used for inter- or extrapolation.

Figure 12.4 Longitudinal and transverse wave force on the visor. Model test results in head and bow sea at 10 and 15 kn speeds.

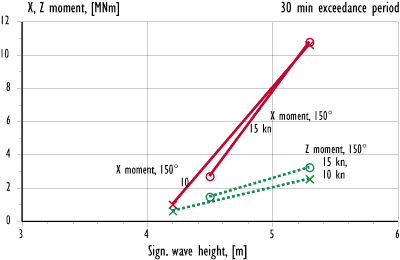
Figure 12.5 Wave-induced moment about visor longitudinal and vertical axis. Model test results in bow sea at 10 and 15 kn speeds.

Figure 12.6 Wave-induced opening moment about visor deck hinge axis. Model test results in head and bow sea at 10 and 15 kn speeds.

It is apparent that the wave height influence is much larger in bow sea than in head sea. The results indicate that there is a 'threshold' sea condition in bow sea below which the wave-induced loads on the visor are very low. When this condition is exceeded, the risk of high forces and moments rapidly increases even though the general condition with regard to motions and accelerations on board is not changed significantly. In the conditions tested, the threshold is apparently found at about 4 m significant wave height.
The wave forces show an approximately linear relation to the speed in bow sea for both wave heights studied. A decrease of speed from 15 kn to 10 kn thus reduces the forces by about one third. In head sea, at higher wave heights, the speed influence seems to diminish.

12.2 Numerical simulation of vertical wave loads on the bow visor

12.2.1 Introduction

Vertical wave loads on the ESTONIA bow visor have also been simulated using a non-linear numerical method to estimate the loads during the accident voyage and to investigate the effects of the most important load parameters. The numerical predictions supplement the SSPA model experiments since it has been possible to simulate much longer time sequences than could be tested in a model basin.
Due to the very complicated flow phenomena around a body entering water, no exact numerical methods exist for analysing the flow, and the simulation method used is based on an engineering approach with which the vertical component of the wave load could be calculated. It has thus not been possible to simulate the other load components or compute the pressure distribution on the visor surface.
The numerical method is discussed in more detail in the complete report in the Supplement. To evaluate the accuracy of the method, the simulated vertical wave loads have been compared with the experimental results.
The simulations have been carried out for long-crested, irregular wave time histories generated according to the JONSWAP wave spectrum formula. In each case, the simulated time sequence was 36 hours long, consisting of six 6-hour simulations. The full simulation programme is shown in Table 12.3.

Table 12.3 Simulated wave-induced vertical loads on the bow visor. Simulation programme and example of results (weight of visor excluded).
Heading
[deg.]
Speed
[kn]
Bow
wave
[m]
Hs
[m]
Tp
[s]
Z force [MN]
Mean
exceed-
ance
period
30 min.
Z force [MN]
Mean
exceed-
ance
period
10 hrs
Head
seas,
180
151.04.08.02.503.60
180151.04.08.52.553.95
180120.654.08.02.053.10
180100.44.08.01.702.70
180100.45.58.04.357.15
180120.655.58.04.807.50
180151.05.58.05.358.10
180151.55.58.06.309.60
Bow
seas,
150
151.04.08.02.954.20
150151.04.58.04.005.60
150151.54.08.03.454.80

12.2.2 Simulation method

The simulation method is based on the non-linear strip theory, which is a practical method for simulating ship motions and hull loads in waves. In the method applied, the time histories of irregular, long-crested waves and ship motions are generated by employing the linear superposition principle. The bow visor was considered as a small body entering water. Thus, in determining the vertical force on the visor it has been assumed that the dynamic wave pressure and the wave motion, velocity and acceleration are constant within the volume occupied by the visor. The assumption is valid when the wave length is significantly longer than the dimensions of the bow visor.
The numerical model includes the hydrostatic and hydrodynamic forces incorporated in the strip method and the non-linear hydrodynamic forces according to the momentum consideration. The non-linearities of the hydrodynamic forces arising from the variation of the submerged portion of the visor are taken into account by considering at each time step the instantaneous waterplane. The following force components are incorporated in the numerical model:

  • Weight of visor, assumed to be 0.6 MN (60 t).
  • Inertia force based on rigid-body vertical acceleration of ship at centre of visor.
  • Hydrodynamic force due to added mass and damping of visor assumed to be proportional to vertical relative acceleration and velocity, respectively. Heave added mass and damping coefficients were computed beforehand at different waterlines with a three-dimensional sink-source method and curve-fitted. At each time step, values corresponding to instantaneous draught were used.
  • Hydrostatic buoyancy force due to instantaneous submerged volume of visor.
  • Froude-Krylov force defined as the integral of the linear hydrodynamic pressure in the undisturbed, incident, wave over submerged surface of visor.
  • Non-linear, vertical impact force in which the important term is rate of change of the heave-added mass times vertical relative velocity squared.
  • Force due to the stationary flow around the submerged visor was computed beforehand by the SHIPFLOW program in calm water at different fore draughts. At each time step, curve-fitted values were used.


The effect of the stationary bow wave was considered as a constant offset increasing the submergence of the visor. Thus, the height of the bow wave estimated by the SHIPFLOW program for different forward speeds was added to the vertical relative motion on the centre line of the visor.

12.2.3 Results

The main results of the simulations are graphs presenting probabilities at which the vertical component of the wave force on the visor exceeds different levels. If exceedance probabilities referring to the number of wave encounters are plotted on a logarithmic scale, and the vertical force on a linear scale, straight lines seem to fit the data quite well. There is no theoretical basis for the linear relationship between the logarithm of the exceedance probability and the vertical visor load. The Weibull distribution has often been applied in fitting long-term wave height and wave load data, but in this case it is unknown how well it would represent the extreme end of the distribution. For this reason, long simulations have been carried out to avoid extrapolation of the data.
The wave load on the bow visor is highly non-linear with regard to wave amplitude. Low waves do not even reach the visor. While the simulated waves have approximately equal wave crest and trough amplitude distributions, a simulated visor load record shows high peaks only when the bow is submerging to the incident wave. When the bow emerges from the water, the force on the visor is close to its weight.
The highest simulated load values have an exceedance probability of about 1/ 30 000, corresponding to the approximately 30 000 waves encountered during the 36-hour total simulation time. Thus the exceedance probabilities may be changed to mean exceedance periods by using the number of waves encountered during the period in question. In head seas at 10 kn speed the vessel encountered about 780 waves per hour and at 15 kn speed 970 waves per hour. In bow seas at 15 kn, the number of wave encounters was 860 per hour.
Table 12.3 summarises the simulation programme and the results in terms of visor loads with mean exceedance times of 30 min. and 10 hours respectively. There is a chance of about 1/20 that during 30 min. of exposure the extreme load was larger than the value corresponding to 10 hours mean exceedance period. The results are given in the same way as for the model tests with the static weight of the visor excluded.
Table 12.3 and Figure 12.9 show the large effect of wave height on the vertical visor loads. When the significant wave height increases in head seas from 4 to 5.5 m, the load increases by 160 % for 10 kn and 120 % for 15 kn. In bow seas, an increase in wave height from 4.0 to 4.5 m causes an increase of about 35 % in the visor load.
The effect of forward speed on the vertical component of the visor load is approximately linear in the lower sea state. Thus, at 15 kn speed the visor load is about 50 % higher than at 10 kn speed in head seas with Hs = 4.0 m. In the higher sea state, the visor load increases more gradually with speed than in the lower sea state. The visor loads increase when the heading changes from head to bow seas by 15 to 20 % in waves of 4 m significant height.
The effect of stationary bow wave height on the visor load is much smaller than the effect of significant wave height. However, the bow wave is taken into account in a rough way in the numerical method and may in reality have a larger effect on the loads.

12.2.4 Comparison with experimental results

Qualitatively the simulated results agree well with the experimental data. The experimental time histories of the vertical load on the visor have high upward peaks similar to those of the simulated records and in the downward direction the loads are negligible. The model tests confirm the very strong effect of wave height on the loads and the approximately linear relationship between visor loads and forward speed. Also in the experiments the visor loads were larger in bow seas than in head seas.
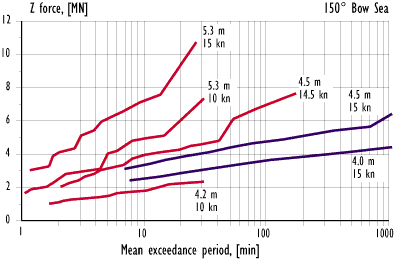
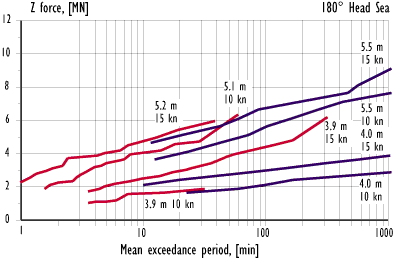
Quantitatively the simulations are compared to the model experiments in Figures 12.7 and 12.8 showing vertical visor load plotted against mean exceedance period, and in Figure 12.9 showing the influence from wave height and speed for 30 minutes mean exceedance period.

Figure 12.7 Comparison of vertical visor loads in oblique bow seas from model tests (red) and from simulations (blue).

Figure 12.8 Comparison of vertical visor loads in head seas from model tests (red) and from simulations (blue).

Figure 12.9 Comparison of vertical visor loads from model tests (red) and from simulations (blue). Influence from wave height and speed.

In all cases, the simulated loads were smaller than the measured loads. In general, the correlation was better in the higher sea state than in the lower. The correlation was very good in the lower sea state at 10 kn speed in head seas. In 4.5 m bow sea at 15 kn speed, the simulated results agreed quite well with the experimental data up to a mean exceedance period of about 40 minutes, after which the test results increased at a much higher rate than the simulated visor loads.
In addition to the general approximate nature of the numerical simulation method and the several simplifying assumptions involved, there may also be other reasons for the growing divergence of the numerical and the experimental results for mean exceedance periods longer than about 30 minutes. Statistics may have contributed to the divergence at the extreme end of the experimental load values since naturally the model tests were not very long.
A second possible reason for the divergence is a difference in the characteristics of the waves. The simulated wave crests and troughs followed the symmetrical Rayleigh distribution while the higher waves of the experimental wave record were unsymmetrical with higher crests than troughs. Some of the wave crest amplitudes in the tests were rather extreme compared to the significant wave height.
Both the model experiments and the simulations indicate, however, that it is not the highest wave crests which exert the largest loads on the visor. It is not clear what kind of individual wave characteristic are mandatory for high loads, but it seems that the wave crest must be relatively high and steep. Often the trough preceding a high visor load has been quite flat. Though the highest wave crests did not cause the highest loads, the experimental results indicate that there may be some correlation between the highest wave crest in the wave record and the highest vertical load on the visor. It may be anticipated that if the wave crest heights are extreme, those wave characteristics which are significant for high loads on the visor may also be extreme.
Waves measured in the open sea in deep water in general follow the Rayleigh distribution quite well. During heavy storms, however, wave crests start to become steeper and troughs become flatter so that their distributions deviate from that in milder conditions. Also, short wave records may include one or a few very high individual waves.

Continues...

Home Summary Contents Next