 |
The vessel had on departure from Tallinn a loading condition that was normal for the route. The car deck contained mainly cargo vehicles. The bunker and stores condition was based on the normal routine of supply during the stop in Stockholm. The trucks and trailers were identified on the cargo manifest for the voyage, giving information about vehicle identity, length, weight and content in general.
 Due to uneven weight distribution on departure the vessel's port side heeling tank was filled. Due to uneven weight distribution on departure the vessel's port side heeling tank was filled.
 Instructions had been given by the chief officer to secure the heavy cargo carefully due to the forecast heavy weather. Instructions had been given by the chief officer to secure the heavy cargo carefully due to the forecast heavy weather.
 Table 5.1 gives the departure condition of the ESTONIA. Deadweight on departure has been estimated to a total of about 2300 t as detailed in Table 5.1. Quantities of oils and water have been estimated by Nordström & Thulin, based on the normal consumption rates and replenishment routines. The weight of the heavy vehicles is taken from the cargo manifest. One truck included in the custom list but not in the cargo manifest has been added to the weight given in the cargo manifest. The number of passenger cars, vans and buses is taken from the custom list. Their weight is an estimate. The hydrostatic particulars are based on calculations by the NAPA program assuming a water density of 1.01 t/m3. The transverse metacentric height of 1.17 m includes the correction due to free liquid surfaces. According to the valid stability booklet the minimum required metacentric height was 0.63 m. Table 5.1 gives the departure condition of the ESTONIA. Deadweight on departure has been estimated to a total of about 2300 t as detailed in Table 5.1. Quantities of oils and water have been estimated by Nordström & Thulin, based on the normal consumption rates and replenishment routines. The weight of the heavy vehicles is taken from the cargo manifest. One truck included in the custom list but not in the cargo manifest has been added to the weight given in the cargo manifest. The number of passenger cars, vans and buses is taken from the custom list. Their weight is an estimate. The hydrostatic particulars are based on calculations by the NAPA program assuming a water density of 1.01 t/m3. The transverse metacentric height of 1.17 m includes the correction due to free liquid surfaces. According to the valid stability booklet the minimum required metacentric height was 0.63 m.
Table 5.1 Departure condition.
| Deadweight |
| Heavy fuel oil (IFO 180) | |
| tank 10 | 108 m3 |
| tank 11 | 108 m3 |
| daytank 36 | 25 m3 |
| settling tank 38 | 20 m3 |
| Total | 261 m3 | 250 t |
| |
| Marine diesel oil | |
| tank 18 | 33 m3 |
| tank 41 | 10 m3 |
| Total | 43 m3 | 35 t |
| |
| Gas oil |
| tank 20 | 12 m3 | 10 t |
| |
| Ballast water | |
| tank 1 | 175 m3 |
| tank 13+14 | 183 m3 |
| Total | 358 m3 | 360 t |
| |
| Fresh water | 300 t |
| |
| Miscellaneous liquids | 50 t |
| |
| Weight on the car deck | |
| Cargo vehicles, 40 units, 1000 t |
| Passenger cars, 25 units, vans, 9 units, buses, 2 units, 100 t |
| Total | 1100 t |
| |
| Crew and passengers | 100 t |
| |
| Miscellaneous | 95 t |
| Total deadweight | 2300 t |
| |
| Floating Condition |
| Draught mean | 5.390 m |
| Trim, positive by stern | 0.435 m |
| Displacement | 11930 m3 |
| Longitudinal CG from aft. perp. | 63.85 m |
| Vertical CG from keel | 10.62 m |
| Transverse metacentric height | 1.17 m |
|
 |
 |
5.4.1 Weather
Forecast
Prior to departure from Tallinn the vessel had received the route-adapted weather forecast from the Swedish Meteorological and Hydrological Institute (SMHI) in accordance with the subscription arrangement. The forecast, issued on 27 September at 1311 hrs, was transmitted by fax and acknowledged by the ESTONIA in the afternoon. It contained the information shown in Table 5.2.
Table 5.2 Weather forecast from SMHI.
| Stretch | Time LT | Mean wind speed on 10 m level (m/s) | Prob. for mean wind >15 m/s in % | Wave height |
| sign (m) | max (m) |
| Naissaar - N Osmussaar | 20-22 | S-SW 10-15 | 20 | 1.0-2.0 | 3.0 |
| N Osmussaar - S Bogskär | 22-04 | SW-W 15-20 | 70 | 2.5-3.5 | 5.5 |
| S Bogskär - Sandhamn | 04-07 | W-NW 18-25 | 90 | 3.5-2.0 | 5.5 |
| Comments: Intense low near Oslo moving E-ward via southern Sea of Bothnia to southern Finland. It will cause increasing SW- later W-NW, from to night gusty wind. At dep. rain with mod vis. Later some short showers. |
In Tallinn the Harbour Authorities forwarded the weather forecasts given by the Estonian Meteorological and Hydrological Institute (EMHI) to ships in port. The forecast distributed during the morning of 27 September predicted south-westerly wind of 12-17 m/s with a wave height of 2-3 m for the Northern Baltic area. At 1230 hrs a new warning message was issued, forecasting the wind to increase to 17-20 m/s, veering to west in the morning of 28 September.
 Prior to departure the vessel also had the use of weather forecasts from the Estonian and Finnish regular broadcasting stations and coastal radio stations on VHF or MF and via the NAVTEX system. Prior to departure the vessel also had the use of weather forecasts from the Estonian and Finnish regular broadcasting stations and coastal radio stations on VHF or MF and via the NAVTEX system.
 The NAVTEX message - transmitted by Stockholm Radio on the morning of 27 September - forecast the wind to be SW 10-13 m/s, increasing first to 17-22 m/s and during the night to 20-25 m/s and veering to west. The NAVTEX message - transmitted by Stockholm Radio on the morning of 27 September - forecast the wind to be SW 10-13 m/s, increasing first to 17-22 m/s and during the night to 20-25 m/s and veering to west.
 After departure, marine weather forecast for the Northern Baltic and the Gulf of Finland could have been received on VHF. The forecasts transmitted during the night of 27 September by Tallinn Radio, Helsinki Radio and Mariehamn Radio all included warnings of winds of 20 to 25 m/s from a westerly direction. After departure, marine weather forecast for the Northern Baltic and the Gulf of Finland could have been received on VHF. The forecasts transmitted during the night of 27 September by Tallinn Radio, Helsinki Radio and Mariehamn Radio all included warnings of winds of 20 to 25 m/s from a westerly direction.
Prevailing weather
The weather situation on 27 and 28 September 1994 has been analysed by the SMHI, FMI and EMHI. The reports of the analyses are given in full in the Supplement.
 According to the reports there was a severe depression covering Northern Scandinavia and the Norwegian Sea. One of the low-pressure centres intensified on 27 September and moved rapidly eastward via southern Norway and eastern Sweden to southern Finland. The depression deepened and was located over Oslo on 27 September at 1400 hrs with pressure 987 hPa. On 28 September at 0200 hrs it was over the south-eastern part of the Gulf of Bothnia with 982 hPa, and at 1400 hrs over eastern Finland with 985 hPa. According to the reports there was a severe depression covering Northern Scandinavia and the Norwegian Sea. One of the low-pressure centres intensified on 27 September and moved rapidly eastward via southern Norway and eastern Sweden to southern Finland. The depression deepened and was located over Oslo on 27 September at 1400 hrs with pressure 987 hPa. On 28 September at 0200 hrs it was over the south-eastern part of the Gulf of Bothnia with 982 hPa, and at 1400 hrs over eastern Finland with 985 hPa.
 A warm front, associated with this low, together with an area of rain, moved quickly eastward during the evening of the 27th over the northern Baltic Sea. South and south-west of the low, the wind shifted from south-westerly to westerly, and then became very gusty. A warm front, associated with this low, together with an area of rain, moved quickly eastward during the evening of the 27th over the northern Baltic Sea. South and south-west of the low, the wind shifted from south-westerly to westerly, and then became very gusty.
 The wind direction, the mean and the maximum wind speeds in m/s at the most relevant observation sites are shown in Table 5.3. The indicated maximum values are the highest mean value for any 10-minute period during the preceding three hours except for Ristna, where the maximum values are measured in gusts. Maximum wind speed in gusts was also recorded at Bogskär and was 24.6 m/s at 2246 hrs on 27 September and 27.7 m/s at 0625 hrs on 28 September. The wind direction, the mean and the maximum wind speeds in m/s at the most relevant observation sites are shown in Table 5.3. The indicated maximum values are the highest mean value for any 10-minute period during the preceding three hours except for Ristna, where the maximum values are measured in gusts. Maximum wind speed in gusts was also recorded at Bogskär and was 24.6 m/s at 2246 hrs on 27 September and 27.7 m/s at 0625 hrs on 28 September.
Table 5.3 Wind observations.
Day/
time | Söder-
arm | Svenska
Högarna | Bog-
skär | Utö | Rus-
sarö | Ristna |
27/9
1700
hours | SW
09 mean
12 max. | SW
12 mean
14 max | SW
13 mean
14 max | SW
09 mean
- | WSW
09 mean
- | SW
08 mean
12 max |
27/9
2000
hours | SW
11 mean
13 max | SSW
14 mean
16 max | S
14 mean
17 max | SSW
13 mean
- | SW
08 mean
- | SSW
08 mean
14 max |
27/9
2300
hours | S
13 mean
17 max | SW
16 mean
18 max | SW
17 mean
18 max | SW
15 mean
- | S
16 mean
- | WSW
16 mean
21 max |
28/9
0200
hours | SW
14 mean
15 max | W
17 mean
18 max | SW
20 mean
21 max | SW
15 mean
- | SW
12 mean
- | WSW
15 mean
22 max |
28/9
0500
hours | W
20 mean
20 max | WNW
24 mean
24 max | W
19 mean
22 max | WSW
15 mean
- | WSW
12 mean
- | W
18 mean
29 max |
28/9
0800
hours | WNW
17 mean
20 max | WNW
18 mean
25 max | WNW
21 mean
24 max | WNW
13 mean
- | WNW
09 mean
- | W
17 mean
26 max |
28/9
1100
hours | WNW
12 mean
17 max | WNW
14 mean
18 max | -
-
- | W
15 mean
- | WNW
11 mean
- | W
12 mean
- |
| For locations of the observation sites, see Figure 13.1. |
5.4.2 Waves
Wave conditions for the night of the accident have afterwards been calculated by the Finnish, Swedish and German institutes of marine research, MTL, SMHI and DW respectively, using their own numerical models of wave growth. The most important input data to the wave calculation models were the estimates of area sea wind speed and direction for a certain time period before and after the accident. The basic wind data were provided by the national meteorological institutes.
 Wave calculation models predict the significant wave height, wave period and mean wave direction at different points of the sea area under consideration. Significant wave height is defined in the numerical models by the area under the wave spectrum, but is very close to the statistical measure of the mean value of the highest one-third of the waves. Wave calculation models predict the significant wave height, wave period and mean wave direction at different points of the sea area under consideration. Significant wave height is defined in the numerical models by the area under the wave spectrum, but is very close to the statistical measure of the mean value of the highest one-third of the waves.
 Table 5.4 shows the significant wave height Hs, spectrum peak or modal wave period Tp, and the mean direction of the waves predicted by the Finnish, Swedish and German institutes of marine research before, during and after the accident. Table 5.4 shows the significant wave height Hs, spectrum peak or modal wave period Tp, and the mean direction of the waves predicted by the Finnish, Swedish and German institutes of marine research before, during and after the accident.
Table 5.4 Summary of wave conditions.
| Institute | Position | Time day, hrs | Hs [m] | Tp [s] | Mean dir. [deg.] |
| MTL, Finland | 59° 25', 22° 35' | 27.9, 2300 | 3 | 7 | 260 |
| SMHI, Sweden | 59° 25', 22° 35' | 27.9, 2300 | 2.9 | 7.1 | 246 |
| MTL | Accident site | 28.9, 0100 | 4.0 | 7.8 | 260 |
| SMHI | Accident site | 28.9, 0100 | 4.1 | 8.4 | 214 |
| MTL | Accident site | 28.9, 0200 | 4.4 | 8.2 | 260 |
| SMHI | Accident site | 28.9, 0200 | 4.3 | 8.7 | 217 |
| DW, Germany | Accident site | 28.9, 0200 | 4.3 | 8.3 | 218 |
| MTL | Accident site | 28.9, 0800 | 5.0 | 8.7 | 270 |
| SMHI | Accident site | 28.9, 0800 | 5.4 | 9.7 | 236 |
MTL experience is that the root-mean-square error in predicted significant wave height is about 0.5 m, in wave period about 1 s, and in wave direction about 10°.
 Due to the wind shift six hours before the accident, waves were at the time of the accident still duration-limited. If the wind direction had remained constant, the waves would have been fetch-limited, significant wave height could have been about 5 m and the modal period about 10 s. This gives the absolute upper limit for the significant wave height. Due to the wind shift six hours before the accident, waves were at the time of the accident still duration-limited. If the wind direction had remained constant, the waves would have been fetch-limited, significant wave height could have been about 5 m and the modal period about 10 s. This gives the absolute upper limit for the significant wave height.
 Numerical predictions by MTL show that significant wave height may increase significantly in shallow water due to focusing of refracted waves. The minimum water depth in the accident area as verified by the Finnish Maritime Administration was over 40 m, which means that there was no shallow-water effect on the route of the ESTONIA. Numerical predictions by MTL show that significant wave height may increase significantly in shallow water due to focusing of refracted waves. The minimum water depth in the accident area as verified by the Finnish Maritime Administration was over 40 m, which means that there was no shallow-water effect on the route of the ESTONIA.
 Numerous studies of wave statistics in a seaway show that during a short interval when the significant wave height may be assumed constant, the distribution of measured wave crest-to-trough heights and heights of individual wave crests and troughs follow closely the Rayleigh distribution. Table 5.5 shows probabilities of an individual wave height exceeding different levels determined by the Rayleigh distribution. Wave height is given in a non-dimensional form divided by the significant wave height. Numerous studies of wave statistics in a seaway show that during a short interval when the significant wave height may be assumed constant, the distribution of measured wave crest-to-trough heights and heights of individual wave crests and troughs follow closely the Rayleigh distribution. Table 5.5 shows probabilities of an individual wave height exceeding different levels determined by the Rayleigh distribution. Wave height is given in a non-dimensional form divided by the significant wave height.
Table 5.5 Short-term wave height exceeding probabilities.
| Height/HS | Prob. of
exceedance |
| 1 | 0.14 |
| 1.5 | 0.01 |
| 2 | 0.00034 |
| 2.2 | 0.0001 |
Thus, if the significant wave height is 4 m, one wave in 100 will be higher than about 6 m. Often as a rule of thumb the maximum wave height is estimated as twice the significant height.
 The calculated significant wave height of about 4 m agrees well with visual observations made on board vessels which took part in the rescue operations. Masters of these vessels have estimated that before the accident waves were not higher than 5-6 m while after the accident individual waves were up to 7-8 m high and in general the wave height was 4-6 m. The estimates of wave height by the Swedish helicopter pilots who arrived at the accident site between 0350 hrs and 0645 hrs vary more than estimates by the mariners. A majority of the pilots have given estimates between 5-6 m or 6-8 m, one pilot gave 6-9 m and another 6-10 m. One pilot reports even a single very high wave of 12 m height measured by radar. The calculated significant wave height of about 4 m agrees well with visual observations made on board vessels which took part in the rescue operations. Masters of these vessels have estimated that before the accident waves were not higher than 5-6 m while after the accident individual waves were up to 7-8 m high and in general the wave height was 4-6 m. The estimates of wave height by the Swedish helicopter pilots who arrived at the accident site between 0350 hrs and 0645 hrs vary more than estimates by the mariners. A majority of the pilots have given estimates between 5-6 m or 6-8 m, one pilot gave 6-9 m and another 6-10 m. One pilot reports even a single very high wave of 12 m height measured by radar.
5.4.3 Light conditions and visibility
During the night of the accident the moon was about half in the last quarter. Moonrise was at about 2150 hrs and sunrise at about 0625 hrs.
Pictures from weather radars (Figure 5.1) show that broken cloud fronts were passing over the Northern Baltic and the accident area at about the time of the accident.
Figure 5.1 Cloud fronts over the Northern Baltic on 28 September 1994 at 0130 hrs (Finnish Meteorological Institute).
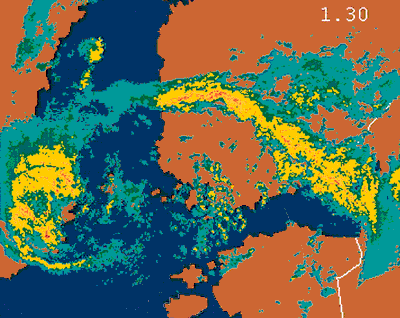
The night was cloudy with an occasional clearing of the sky just before midnight. After midnight the cloud coverage gradually increased again and in the early morning the sky was cloudy.
 For most of the night visibility was more than ten nautical miles, but was occasionally reduced by rain showers. For most of the night visibility was more than ten nautical miles, but was occasionally reduced by rain showers.
5.4.4 Hydrological conditions
Currents were not measured during the night of the accident in the northern Baltic. However, the surface current speed and direction were later estimated by both MTL and SMHI.
 According to MTL the velocity of the surface current was between 0.2 and 0.6 knots in an easterly direction at the time of the accident. The velocity of the current was estimated by SMHI to be 0.5 knots in a direction between east and north east. According to MTL the velocity of the surface current was between 0.2 and 0.6 knots in an easterly direction at the time of the accident. The velocity of the current was estimated by SMHI to be 0.5 knots in a direction between east and north east.
 A surface water temperature of between 12°C and 13°C was measured in the accident area before midnight on 27 September. After midnight the temperature dropped to 10°C-11°C. A surface water temperature of between 12°C and 13°C was measured in the accident area before midnight on 27 September. After midnight the temperature dropped to 10°C-11°C.
 The air temperature during the night was 12°C-8°C. The air temperature during the night was 12°C-8°C.
|
 |
 |
There are no recordings of the speed of the ESTONIA during her voyage from the harbour in Tallinn to the time of the accident. The Commission has made an estimation of how the speed was affected by the waves, inter alia by comparing her speed with the speed of the SILJA EUROPA, another passenger ferry steering a nearly parallel course about eight nautical miles north of the track of the ESTONIA. Other available observations have also been used in the estimations. The speed of the SILJA EUROPA is taken from the DGPS recording which 30 times/minute registers the position, the time, the speed over ground, the course over ground and the heading. The data reveal how the speed was affected by the wind and waves.
 The ESTONIA departed from Tallinn 15 minutes late from her normal schedule. The manoeuvre from the port to the Tallinn leading lights is estimated to have taken about 10 minutes. It must be assumed that full service speed, i.e. about 19 knots, was maintained from the Tallinn breakwater to Osmussaar lighthouse, which she passed very close at 2200 hrs. Her estimated speed was still close to 19 knots and she was now a few minutes ahead of normal schedule. Between 2215 and 2245 hrs (approximate) the ESTONIA was plotted by a meeting vessel, the AMBER and according to Amber's plot, the speed was then about 18.5 knots. The speed of the SILJA EUROPA was at this point 18.8 knots and further decreased to 17.6 knots between Russarö lighthouse and the Apollo buoy. The ESTONIA departed from Tallinn 15 minutes late from her normal schedule. The manoeuvre from the port to the Tallinn leading lights is estimated to have taken about 10 minutes. It must be assumed that full service speed, i.e. about 19 knots, was maintained from the Tallinn breakwater to Osmussaar lighthouse, which she passed very close at 2200 hrs. Her estimated speed was still close to 19 knots and she was now a few minutes ahead of normal schedule. Between 2215 and 2245 hrs (approximate) the ESTONIA was plotted by a meeting vessel, the AMBER and according to Amber's plot, the speed was then about 18.5 knots. The speed of the SILJA EUROPA was at this point 18.8 knots and further decreased to 17.6 knots between Russarö lighthouse and the Apollo buoy.
 After passing Osmussaar lighthouse the ESTONIA lost her land shelter and the sea conditions deteriorated. Based on experience it is believed that the sea conditions were slightly worse in the area where the SILJA EUROPA was sailing. After passing Osmussaar lighthouse the ESTONIA lost her land shelter and the sea conditions deteriorated. Based on experience it is believed that the sea conditions were slightly worse in the area where the SILJA EUROPA was sailing.
 At about 2255 hrs the Apollo buoy was abeam and the ESTONIA's speed is estimated to have been close to 17 knots. At about 2255 hrs the Apollo buoy was abeam and the ESTONIA's speed is estimated to have been close to 17 knots.
 The ESTONIA passed the Glotov buoy at about 2355 hrs and, by comparing with the SILJA EUROPA, it can be assumed that her speed was now about 15 knots. This estimate is also confirmed by the trainee second officer, who has stated that the speed was between 14 and 15 knots, as well as by the third engineer who has stated that the speed was 15 knots when he started his watch in the engine control room at midnight. The ESTONIA passed the Glotov buoy at about 2355 hrs and, by comparing with the SILJA EUROPA, it can be assumed that her speed was now about 15 knots. This estimate is also confirmed by the trainee second officer, who has stated that the speed was between 14 and 15 knots, as well as by the third engineer who has stated that the speed was 15 knots when he started his watch in the engine control room at midnight.
 During the first thirty minutes after midnight the average speed of the SILJA EUROPA dropped by about one knot. During the first thirty minutes after midnight the average speed of the SILJA EUROPA dropped by about one knot.
 When the ESTONIA reached the waypoint at 59°20´ N, 22°00´ E between 0025 and 0030 hrs, her true course was changed from 262° to 287° and the stabilisers were extended. Her average speed was between 14 and 15 knots. When the ESTONIA reached the waypoint at 59°20´ N, 22°00´ E between 0025 and 0030 hrs, her true course was changed from 262° to 287° and the stabilisers were extended. Her average speed was between 14 and 15 knots.
 Table 5.6 gives the speed of the SILJA EUROPA and illustrates how the sea state affected her speed. At 0042 hrs the SILJA EUROPA changed course from 259° to 276°. The change of course and possibly also deteriorating sea conditions resulted in increased motion of the vessel and at 0059 hrs the officer of the watch reduced the speed to 13 knots. The position of the SILJA EUROPA at about 0100 hrs was bearing approximately 350° and distance 10 nautical miles from the ESTONIA. Table 5.6 gives the speed of the SILJA EUROPA and illustrates how the sea state affected her speed. At 0042 hrs the SILJA EUROPA changed course from 259° to 276°. The change of course and possibly also deteriorating sea conditions resulted in increased motion of the vessel and at 0059 hrs the officer of the watch reduced the speed to 13 knots. The position of the SILJA EUROPA at about 0100 hrs was bearing approximately 350° and distance 10 nautical miles from the ESTONIA.
Table 5.6 The recorded speed of SILJA EUROPA.
| Time, hrs | Max [kn] | Min [kn] | Aver [kn] |
| 0030 | 16.4 | 14.8 | 15.4 |
| 0035 | 16.4 | 15.3 | 15.9 |
| 0040 | 16.8 | 15.4 | 16.1 |
| 0045 | 16.4 | 14.8 | 15.6 |
| 0050 | 16.2 | 14.7 | 15.6 |
| 0051 | 16.6 | 14.8 | 15.8 |
| 0052 | 15.7 | 14.3 | 15.2 |
| 0053 | 16.1 | 14.9 | 15.6 |
| 0054 | 16.0 | 14.2 | 15.0 |
| 0055 | 15.5 | 13.3 | 14.6 |
| 0056 | 15.3 | 13.9 | 14.4 |
| 0057 | 15.5 | 13.8 | 14.6 |
| 0058 | 14.9 | 11.6 | 13.9 |
| 0058 | 14.9 | 11.6 | 12.9 |
| 0059 | 13.9 | 11,7 | 12.7 |
| 0100 | 14.5 | 12.9 | 13.4 |
| 0105 | 13.6 | 11.9 | 12.9 |
| 0110 | 13.8 | 12.1 | 12.9 |
| 0115 | 13.2 | 10.7 | 12.3 |
| 0120 | 12.6 | 10.9 | 12.4 |
| 0125 | 13.6 | 9.6 | 13.3 |
| 0130 | 10.7 | 9.1 | 10.7 |
In the table the Max, Min and Aver columns give the highest, the lowest and the average speeds, respectively, during one minute. |
 |

